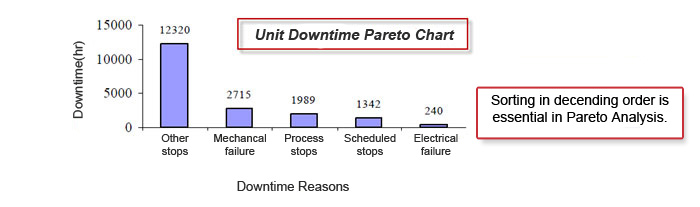
Errors can be classified in terms of correction costs and product performance. Pareto analysis shows which problems should be considered first. This diagram is used by quality groups, to make the right decisions and to direct the efforts in a more efficient area. By pareto analysis, the problems are sorted in descending order and the priority of the problems and the solutions are determined.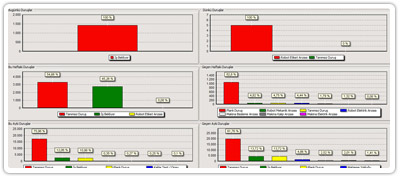 Usually %80 of problems are caused by %20 of errors. In normal distribution, %20 of most important reasons are %80 of the results, next %30 are %15 of the results and the remaining %50 are %5 of the results. 80% of the cost is caused by %20 of the elements or %80 of the wealth is in the hands of 20% of the population are the cases that are examples of this issue. These rates in the literature due to Pareto principle are called "80-20", "90-10" rule or "70-30" rule. Pareto chart also known as ABC analysis is used as conventional separation method or priority determination..
Possible presence of all errors in a product can not be said that have the same degree of importance (Kobu 1987:274). Pareto analysis is a technique used to separate different number of reasons from less important reasons. This technique, with the help of graphical display of the event and direct the attention to the most important cause of problem or issue.First of all error detection is needed. Then, gathering and listing all the elements that caused the error is the first phase.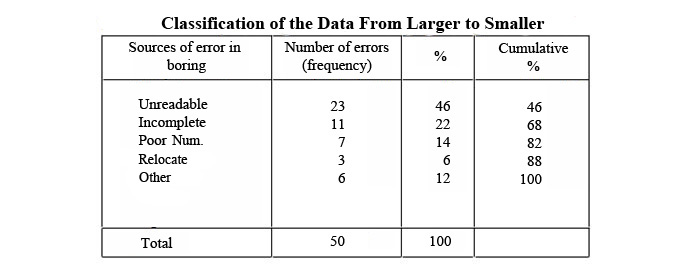
For a specific period(month, 3 months, etc.), the sample data is collected about all the elements which will be examined. Boring errors are classified as, unreadable, incomplete, poor numbering, relocation, other and total number of errors for each one of them is written for specified period. Then their rates in total fault is found. For example unreadable, (23/50) * 100 = 46%. And in the last column above are cumulative totals.
46, (46 +22), (46 +22 +14), (46 +22 +14 +6), (46 +22 +14 +6 +), (46 +22 +14 +6 +12) and value 100 is reached.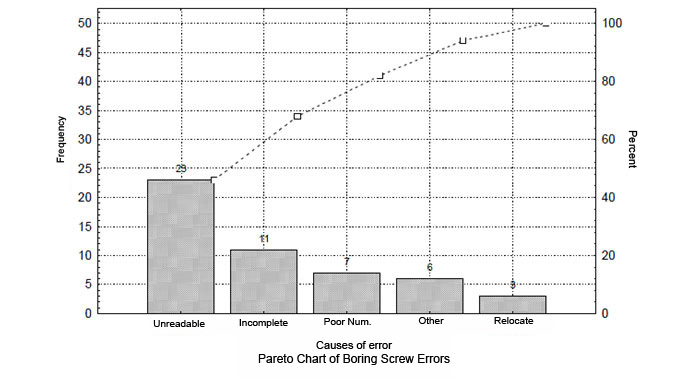
In Trex DCAS, the effect of both stops, failures, as well as the disribution of manufacturing errors in a certain period to the total can be seen. Actual distribution of failures can be monitored. For the largest, with considering a lower level, Pareto Analysis can be done only for the factors that cause it. This analysis take us to ROOT CAUSE.
SAMPLE APPLICATION FOR PARETO ANALYSIS
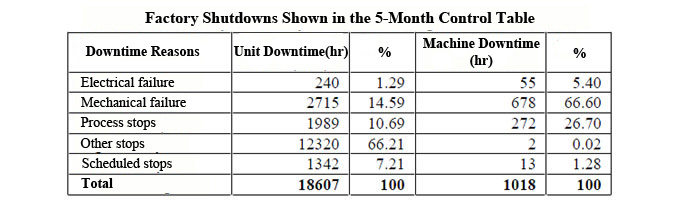
Here, for both the unit and the machine Pareto can be performed and disadvantages can be analyzed separately.